In Zimbabwe's fast-moving financial markets, investors need tools that can quickly convey complex information. Our new Market Heatmap feature transforms market data into an intuitive visual format, helping you make better investment decisions in seconds.
"The heatmap has become my first stop every morning - in 10 seconds I can see which sectors are moving and where the opportunities might be."
- Tinashe M, Premium Member
What Makes Our Heatmap Unique?
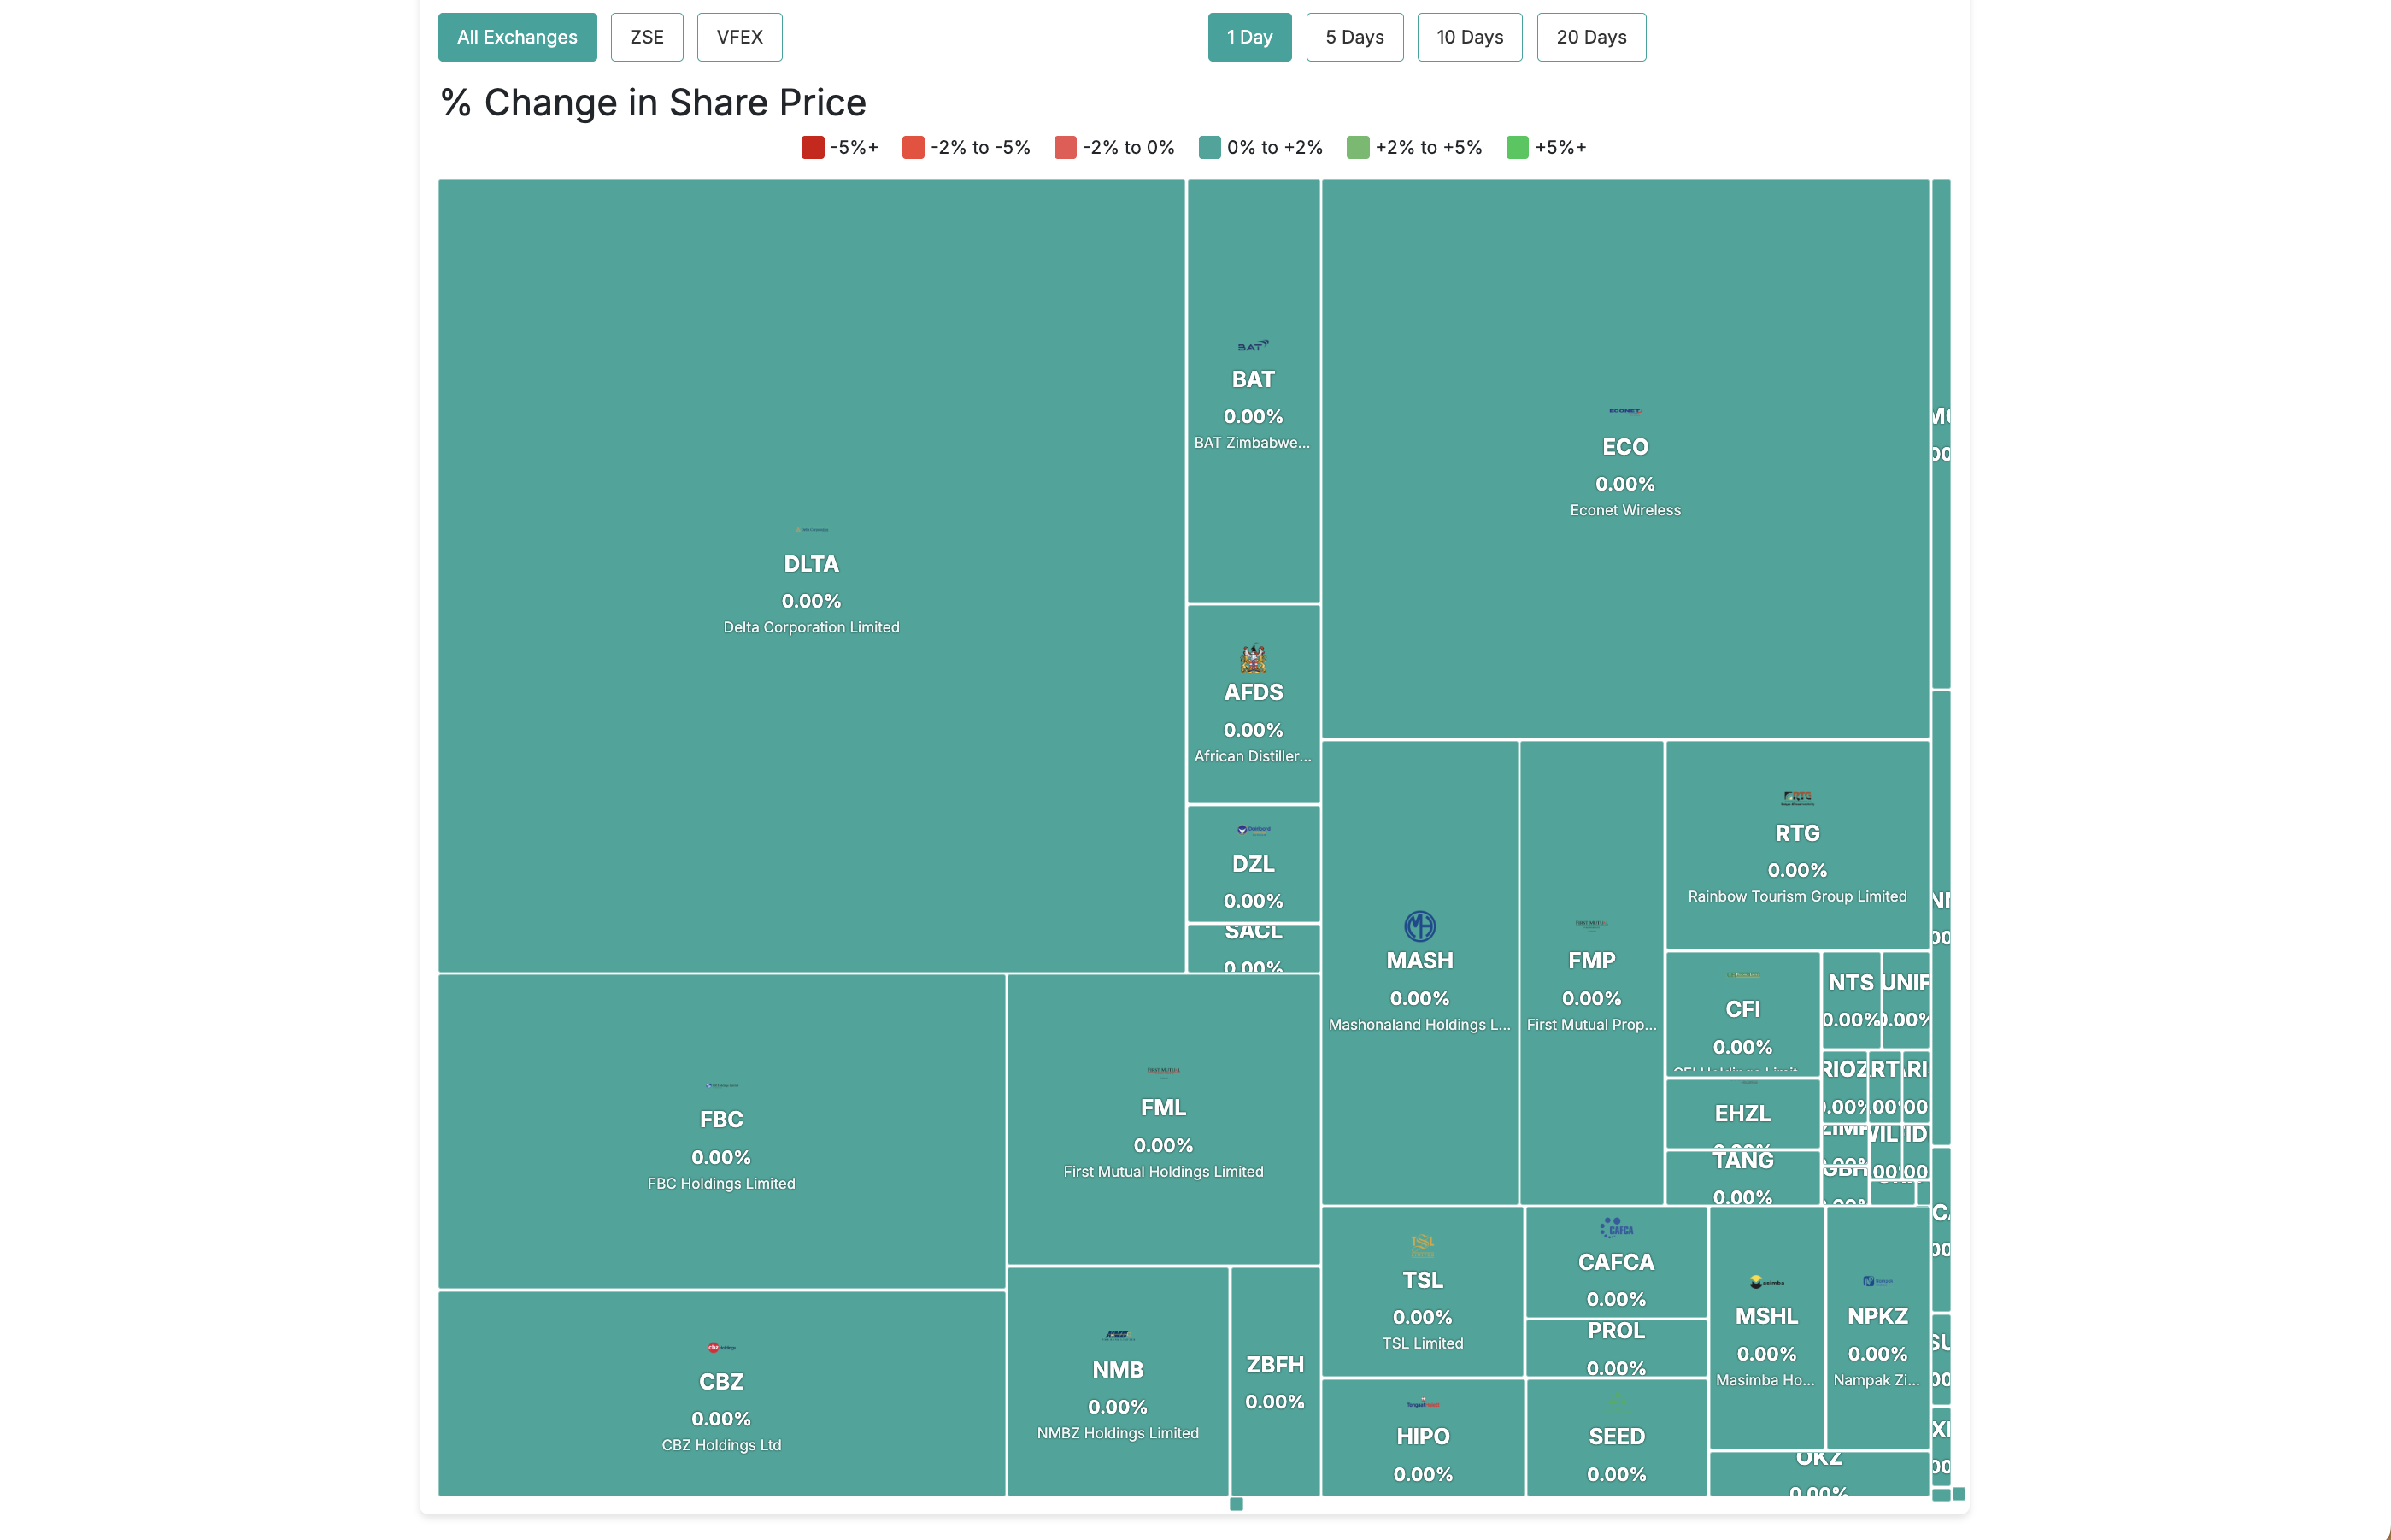
Unlike traditional tables or charts, our heatmap represents the entire market visually:
- Color-coded performance from deep red (losses) to bright green (gains)
- Size-scaled blocks showing each company's market capitalization
- Sector grouping that reveals industry trends at a glance
Key Features for Zimbabwean Investors
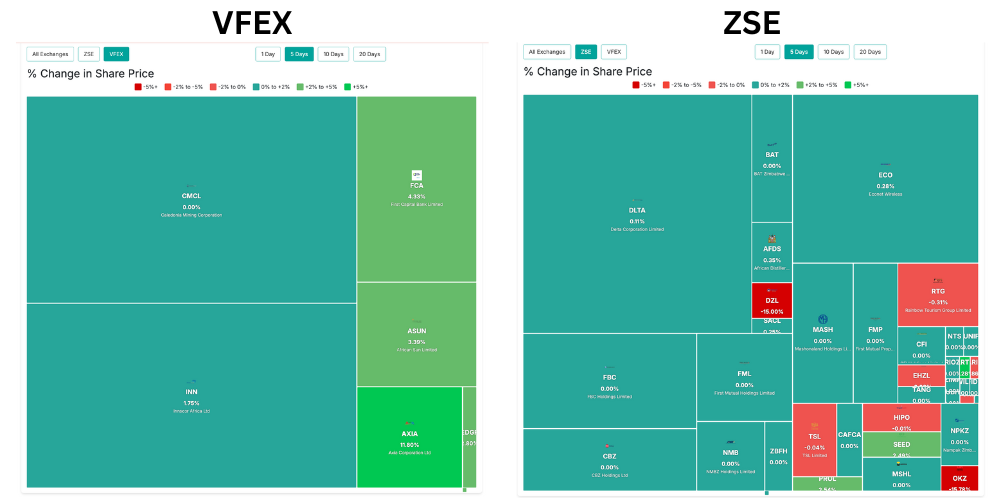
1. Dual Exchange Visualization
Toggle between ZSE (ZWL) and VFEX (USD) with one click, or view both exchanges together to compare performance across currencies.
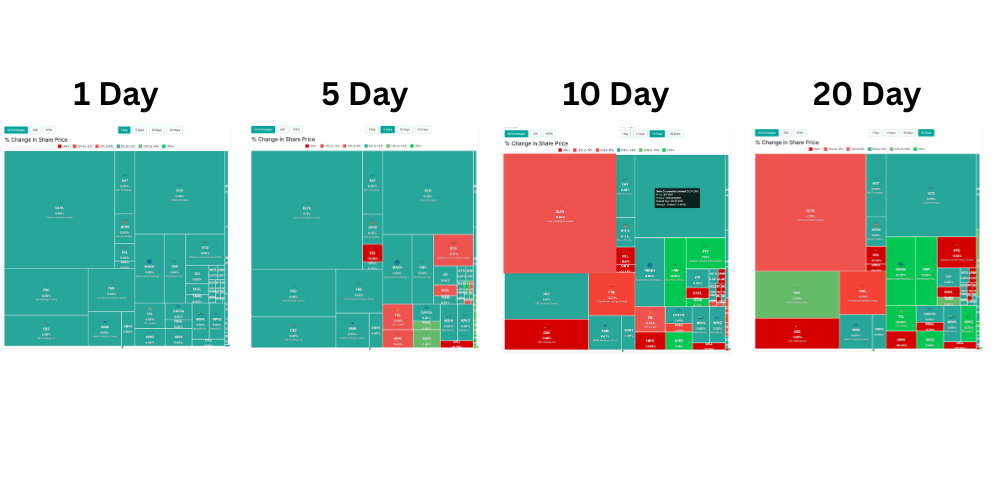
2. Timeframe Analysis
Switch between different time periods to identify trends:
| Timeframe | Best For |
|---|---|
| 1-day | Daily trading opportunities |
| 5-day | Short-term momentum |
| 10-day | Emerging trends |
| 20-day | Medium-term sector rotation |
3. Sector Performance Breakdown
The heatmap automatically groups stocks by sector, making it easy to spot which industries are driving market movements.
Practical Applications
For Long-Term Investors
- Identify undervalued sectors for dollar-cost averaging
- Monitor your portfolio's sector allocation
For Active Traders
- Quickly identify momentum plays
- Find oversold candidates for mean reversion
Premium Features
Upgrade to unlock advanced heatmap functionality:
Our premium members can isolate specific sectors, see dedicated top gainers/losers lists, and even compare current heatmaps to historical periods to identify recurring patterns.